Key Tax Avoidance Statistics
- Tax avoidance makes up around 5% of the total UK tax gap in 2019.
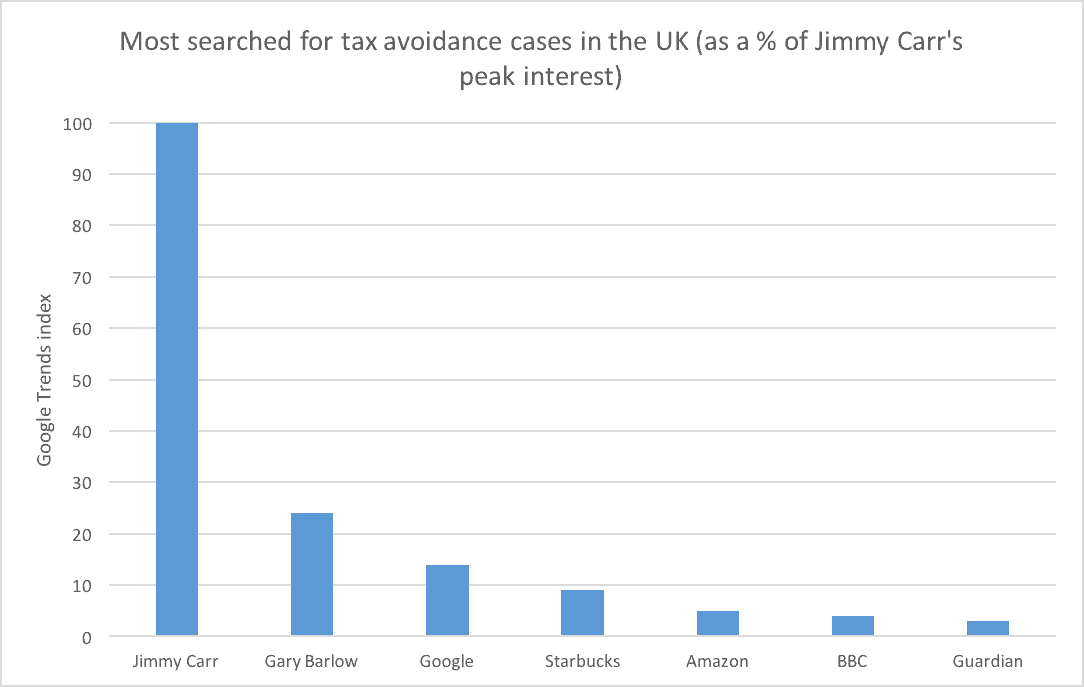
- Top Google search terms on this subject involve specific tax avoidance cases in the UK and beyond – namely those of Jimmy Carr, Google, Starbucks, Amazon, BBC, Gary Barlow and The Guardian.
- Corporation tax avoidance was estimated to amount to £0.8 billion in 2016-17.
- Between 2006 and 2017, tax avoidance decreased by 50%
- Over the next five years, the new loan charge introduced as the result of disguised remuneration schemes will bring in around £3.2 billion for UK public finances.
Tax Avoidance in the UK – The Basic Facts
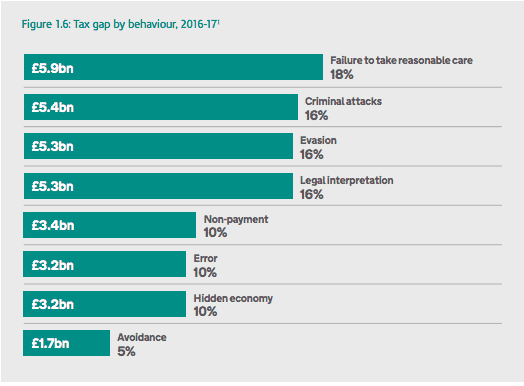
Recent tax avoidance statistics show that this type of activity currently costs the UK around £1.7 billion per year. As of 2016-17, this made up 5% of the overall “UK tax gap” – the difference between the tax that is owed and the amount that is actually paid.
The rest of the tax gap is made up of the following factors:
- Failure to take reasonable care
- Criminal attacks
- Tax evasion
- Legal interpretation
- Non-payment of tax
- Taxation error
- Hidden economy
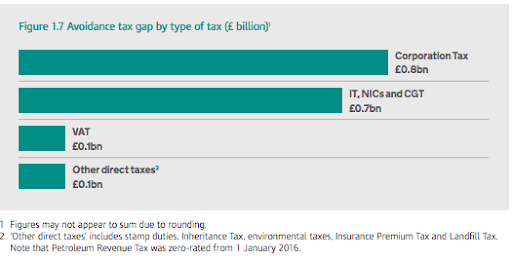
Of the aforementioned £1.7 billion gap that is caused by tax avoidance, around 45% comes from the avoidance of Corporation Tax. A combination of the avoidance of Income Tax, National Insurance Contributions and Capital Gains Tax makes up another 44% approximately, while the remainder is attributed to VAT and other direct tax avoidance.
Since 2005, there has been a gradual reduction in the UK tax gap. In 2019 there is still a considerable disparity, however.
During the 2005-2006 tax year, Corporation Tax avoidance peaked at £2.8 billion, while IT, NICs and CGT avoidance stood at just over half that amount (£1.5 billion). Despite being the lower of the two, this figure was still double that of the tax year 2016-17.
After 2006, Corporation Tax avoidance dropped until it hit £1.4 billion in 2009-10, then saw a brief rise to £1.7 billion in 2010-11. It then dropped again to £0.7 billion in 2012-13, and, at present, the figure has been sitting at a consistent £0.8 billion since 2013-14.
On the other hand, over the same timescale, IT, NICs and CGT avoidance rose from £1.5 to £1.6 billion between 2006 and 2007. The next two tax years saw it drop significantly to £0.9 billion, but it then climbed gradually, overtaking Corporation Tax in 2012-13 (where they were at £1.2 billion and £0.7 billion respectively) and peaking at £1.4 billion in 2013-14. Since that time, however, it has been in swift decline, dropping below Corporation Tax once more in 2016-17 – when the former stood at £0.8 billion and the latter at £0.7 billion.
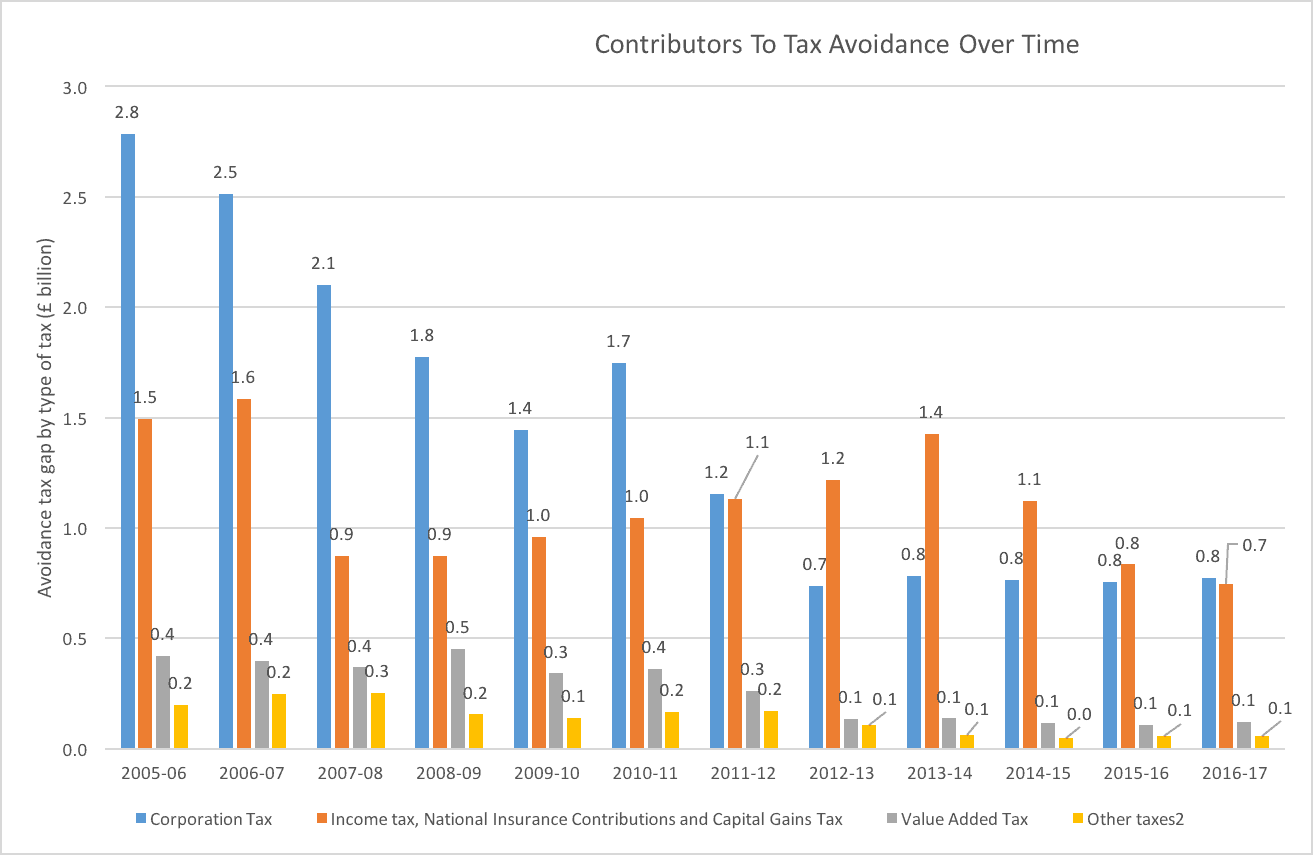
UK Tax Avoidance Statistics Over Time
Avoidance of Income Tax, Capital Gains Tax and National Insurance Contributions has declined by more than half since 2005-06, falling from £1.5 billion to £0.7 billion.
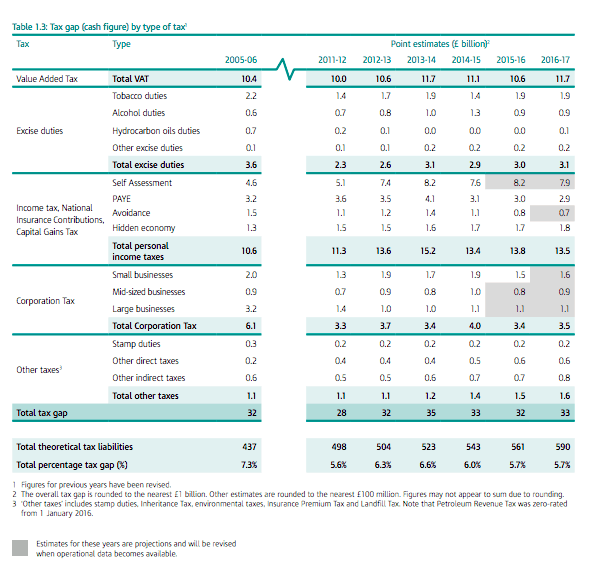
Tax avoidance overall has generally seen a steady downward trend from £4.9 billion to £1.7 billion between 2005-06 and 2016-17.
This represents the biggest decrease out of any of the other tax gap factors where customer behaviour has been more consistent.
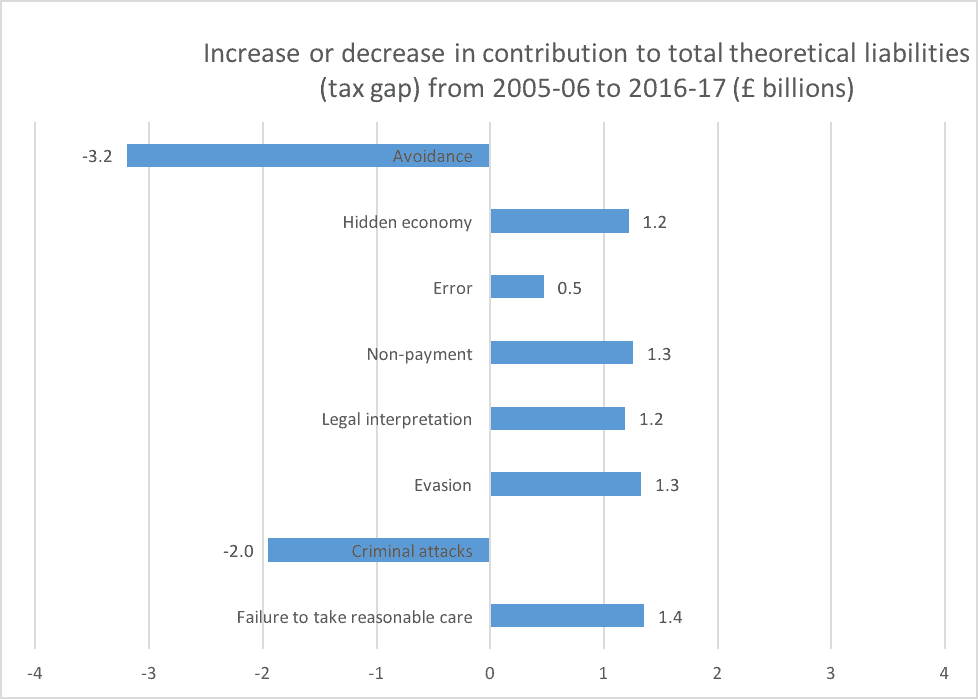
However, compared to the other factors involved in the current tax gap, tax avoidance is the behaviour that contributes towards it the least. “Failure to take reasonable care” is the clear front runner in this field, costing the UK economy £5.9 billion in 2016-17 alone.
Following this is “criminal attacks”, which contribute £5.4 billion to the tax gap, while both “legal interpretation” and “tax evasion” are tied at £5.3 billion to round off the top three most costly factors.
Issues relating to VAT and Self Assessment are also more costly than tax avoidance to the UK economy.
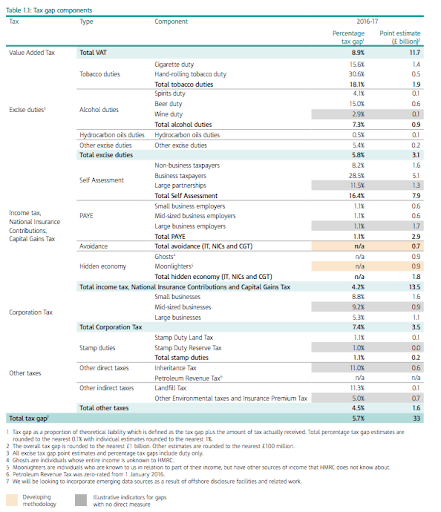
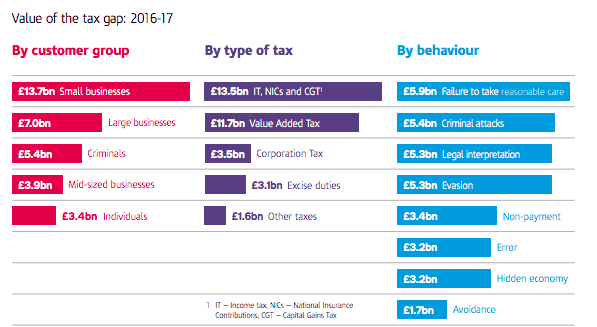
Please note that these figures are constantly changing as HMRC updates its methods used to measure the true scale of the tax gap.
Celebrities, High Grossing Companies and Tax Avoidance
The most searched-for topics related to tax avoidance in the UK reveal a great amount of interest in individual high profile cases.
The following search terms have increased in popularity by 5,000% or more over the last five years:
- “Gary Barlow tax avoidance scheme” (+5,000%)
- “Arctic Monkeys tax avoidance” (+5,000%)
- “Gabby Logan tax avoidance” (+5,000%)
- “Gary Lineker tax avoidance” (+5,000%)
- “Nandos tax avoidance” (+5,000%)
- “Ladbrokes tax avoidance” (+5,000%)
- “Caffe Nero tax avoidance” (+5,000%)
While “G4s tax avoidance” has increased by 4,250%, “Take That tax avoidance” has increased by 700% and searches for “HSBC tax avoidance” have gone up by 300%.
Far more people are searching for information related to these cases, or for general terms such as “tax avoidance schemes”, than are using search engines to discover how they may avoid tax themselves.
“Tax avoidance vs tax evasion” is also a popular search, revealing that users are interested in educating themselves on the semantics of the field.
Over the past five years, most UK-based search activity regarding tax avoidance has focused around Google, Amazon, BBC, Starbucks and singer and TV personality Gary Barlow. However, over the last twelve months, the tax avoidance case of comedian Jimmy Carr has attracted considerably heightened attention. “Jimmy Carr tax avoidance” saw a 250% increase in search volume over the past 12 months.
Recent tax avoidance scandals that have prompted the highest Google search volumes are:
- Jimmy Carr
- Starbucks
- Amazon
- BBC
- Gary Barlow
- The Guardian
Jimmy Carr’s K2 case in 2012 interested the UK more than any other case, with the peak in search interest for Gary Barlow’s tax avoidance only hitting ¼ of the level of Carr’s peak.
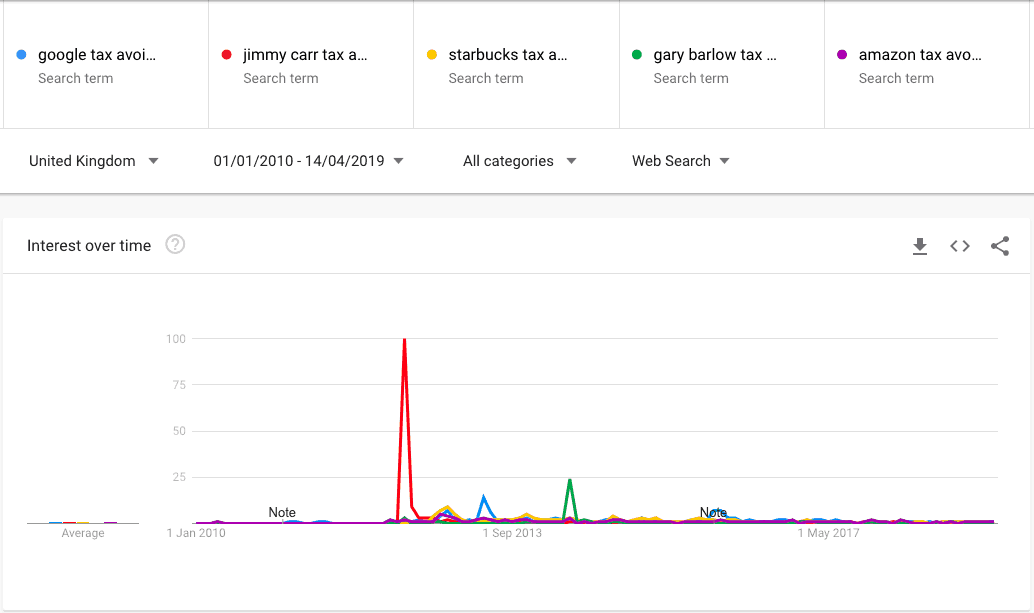
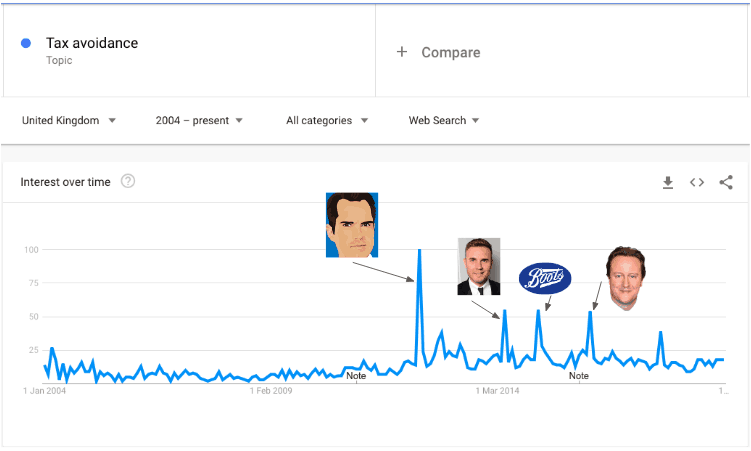
In general, tax evasion has had consistently more search interest over the past five years than avoidance. In fact, interest in the latter has slightly decreased, while the former has seen a minor increase.
Tax Avoidance in the UK by Region
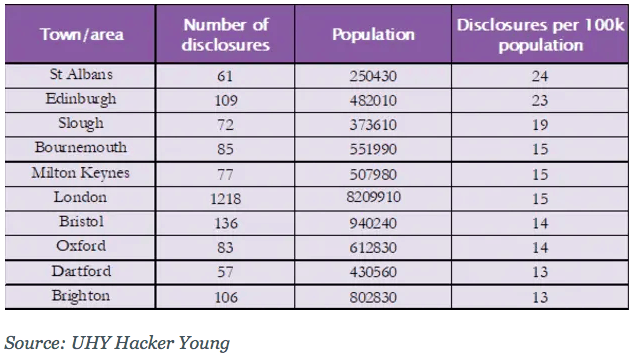
Areas of the UK that have previously seen the highest number of disclosures for tax avoidance include:
- St Albans
- Edinburgh
- Slough
- Bournemouth
- Milton Keynes
- London
- Bristol
- Oxford
- Dartford
- Brighton
St Albans’ numbers revealed that, on average, 24 disclosures were made per 100,000 people in the area. That’s 61 disclosures within a population of 250,430.
Brighton, sharing the lowest spot in the top ten, saw an average of 106 disclosures made within a population of 802,830. That equates to 13 disclosures in 100,000 people.
This figure matches that of Dartford, which saw 57 disclosures in a population of 430,560.
Disguised Remuneration Schemes
One major tool used in tax avoidance is Disguised Remuneration. This was a method whereby employers would pay money into a trust fund, which would then be distributed to employees or contractors in the form of a “loan”. This loan was never intended to be repaid, but labelling it thus allowed both the employer and the employees to avoid paying duties such as NICs and Income Tax.
Those involved in a Disguised Remuneration scheme have now been ordered by the UK government to pay all taxes on the total amounts they have been “loaned” under Finance Act (No.2) 2017. This will be applied as tax on one years’ income. It is known as the “loan charge”, and came into effect in April 2019.
Because there are estimated to have been around 500,000 users of Disguised Remuneration schemes – and with 70% having used their scheme for two years or more – the payout from this action be the government is predicted to be considerable – potentially bringing in an extra £3.2 billion for the public revenue over the next five years.
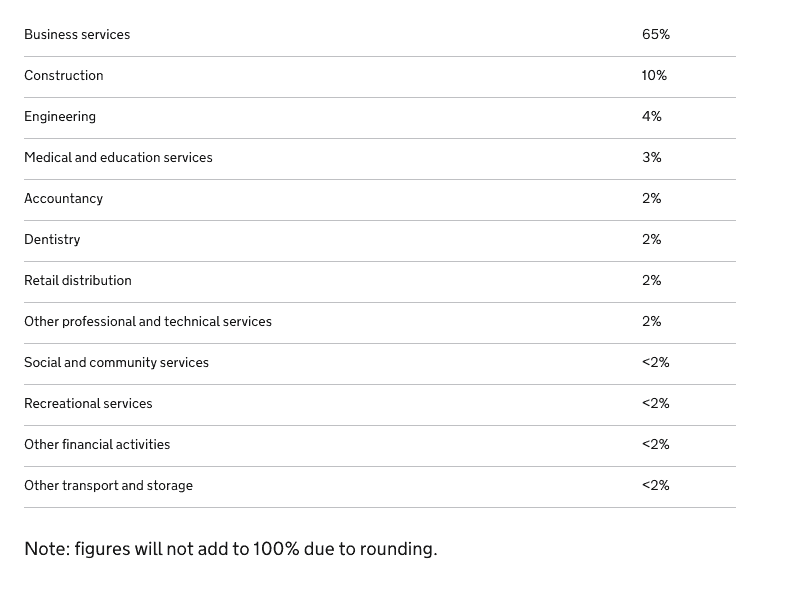
The below breakdown of those affected by the loan charge reveals that they fall mainly into the following categories:
- Business services – including IT consultants, financial advisers and management consultants (65%)
- Medical services and teaching (3%)
- Social and community services (2%)
The tax bills for people who repeatedly used these schemes will be higher than those who have used them once, and as a result of their use of this method, users of these schemes will, on average, have brought in around twice as much income as a typical UK taxpayer.
In conclusion, while the UK tax gap is gradually becoming smaller, Corporation Tax and IT, NICs and CGT remain the most costly areas when it comes to tax avoidance.
At the current time, the UK towns seeing the highest numbers of tax avoidance disclosures are in the south of England, with the exception of Edinburgh, which sees the second most.
Online interest in tax avoidance focuses mainly on celebrity or corporate scandals.
As part of their continued focus on closing the tax gap, the government’s action regarding Disguised Remuneration schemes is likely to direct a considerable amount of previously unpaid tax back into the UK’s public revenue.
Get In Touch
For professional and insurance reasons Patrick is unable to offer any advice until he has been formally instructed.


